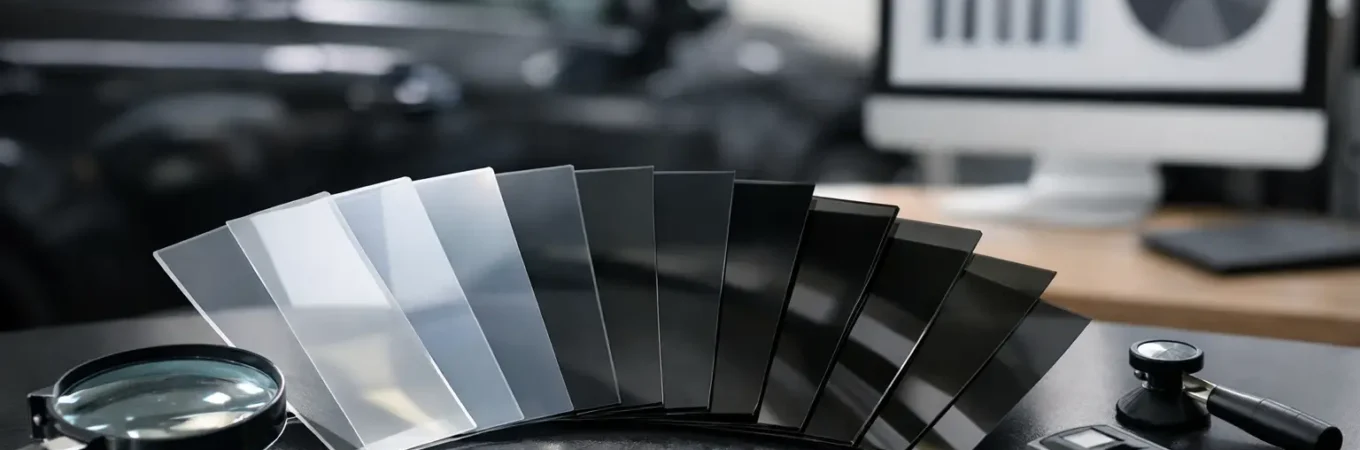
If you have ever looked at tint options and thought 5%, 20%, and 35% all sounded backwards, you are not alone. A tint shade percentage chart clears that up fast. The percentage tells you how much visible light gets through the film, so the lower the number, the darker the tint looks from the outside and the less light comes into the vehicle or building.
That one detail helps people make better choices, but it does not answer everything by itself. The right shade depends on how much privacy you want, how much glare and heat you are dealing with, how you use the vehicle or space, and what is legal in your area. That is why a chart is useful, but real-world context matters just as much.
How a tint shade percentage chart works
A tint shade percentage chart is built around visible light transmission, often called VLT. If a film is 70%, it allows 70% of visible light to pass through. If it is 20%, only 20% passes through. Lower percentage means darker film.
This is where a lot of people get tripped up. They hear a higher number and assume it means more tint. It is actually the opposite. A 5% film is much darker than a 50% film.
For most drivers and property owners, these are the shades people ask about most often:
- 70% tint is very light. It keeps a clear appearance while helping with glare and UV protection.
- 50% tint is light to medium. It gives some soft shading without making the glass look very dark.
- 35% tint is a popular middle ground. It changes the look, adds comfort, and still keeps decent visibility.
- 20% tint is noticeably dark. It offers more privacy and a stronger tinted appearance.
- 5% tint is extremely dark and often called limo tint. It gives maximum privacy but greatly reduces visibility, especially at night.
A chart helps you compare these numbers quickly, but seeing them on actual glass is different from reading them on a screen. Vehicle interior color, sunlight, weather, and even the angle you are standing at can change how dark a shade appears.
What each tint percentage actually feels like
The best way to use a tint shade percentage chart is to connect each number to what you will notice day to day.
70% tint
This is a good choice for people who want a very light tint. It does not create much privacy, but it can cut glare and help with UV exposure. It is often considered for windshields where permitted, or for homes and offices where you want protection without a dark appearance.
50% tint
At 50%, you still have a fairly open look, but there is more comfort than clear glass. This works well for drivers who want a mild upgrade instead of a dramatic blackout style. For property glass, it can reduce harsh sunlight without making rooms feel closed in.
35% tint
This is one of the most balanced options. It gives a clear tinted look, adds some privacy, and helps with glare and heat. Many customers like 35% because it looks clean without going too dark for everyday driving.
20% tint
This shade is darker and more private. It is a strong visual upgrade and can be a great fit for side and rear glass if you want the vehicle to look more aggressive or more protected from outside view. The trade-off is reduced visibility at night, especially on poorly lit roads.
5% tint
This is about as dark as it gets in common conversation. It creates a bold look and high privacy, but it is not for everyone. Night driving visibility can suffer, and legal restrictions are often tighter at this level.
A chart does not tell the whole story
Two vehicles with the same film percentage can look different. A black truck with a dark interior can make 35% look deeper than it does on a light-colored sedan with a tan interior. Factory privacy glass also changes the final result, especially on SUVs and rear glass.
For homes and businesses, the same issue applies. Large south-facing windows may feel dramatically different with 35% film than a shaded room with the same product. The percentage tells you visible darkness, but it does not fully describe heat rejection, glare control, or comfort.
That is where film type matters.
Shade versus performance
A common mistake is thinking darker always means better heat reduction. It does not. Shade and performance are related, but they are not the same thing.
A lower-quality dark film may look good but do less for heat rejection than a lighter, better-performing ceramic film. That matters a lot in East Tennessee summers when the goal is not just privacy, but a cooler interior and less strain from direct sun.
Carbon film can be a solid value choice for appearance and everyday comfort. Ceramic options usually step up heat rejection and UV protection without forcing you into the darkest shade. That means someone can choose a lighter look and still get serious performance benefits. If you care about comfort as much as style, that trade-off is worth paying attention to.
Using a tint shade percentage chart for cars
For automotive tint, most customers are balancing four things: appearance, privacy, daytime comfort, and night visibility. The chart helps narrow it down.
If you want a subtle factory-plus look, 50% or 35% may be the right lane. If you want stronger privacy on side and rear windows, 20% is often where people start getting the look they pictured. If you are aiming for maximum darkness, 5% makes a statement, but it can also create headaches with visibility and legal compliance.
Windshield tint is its own category. Even a very light windshield film can make a big difference in glare and heat, but it needs to be chosen carefully. This is one of those areas where the chart is helpful, but professional guidance matters more than guessing.
Using a tint shade percentage chart for homes and businesses
Residential and commercial window film decisions are usually less about style and more about comfort and function. A tint shade percentage chart still helps, but the questions change a bit.
Homeowners often want to reduce glare in living rooms, protect flooring and furniture from UV damage, and keep rooms from heating up in the afternoon. Business owners may want a cleaner exterior appearance, better comfort for staff and customers, and more privacy for office or storefront areas.
A very dark film is not always the best answer for a property. It can reduce natural light more than you want and change the feel of the space. In many cases, a moderate shade with a higher-performing film gives better day-to-day results than simply going as dark as possible.
Legal limits matter
A tint shade percentage chart is a visual tool, not a legal guide. State laws can regulate how dark your tint can be, which windows can be tinted, and whether reflective films are allowed. Vehicle rules can also differ from what is acceptable on residential or commercial glass.
That is why choosing tint based only on looks can backfire. What seems perfect in a photo may not be legal for your specific vehicle setup. It is always smarter to match the shade to both your goals and the rules that apply.
How to choose the right percentage without overthinking it
Start with the result you care about most. If your top goal is privacy, you will likely lean darker. If your top goal is heat rejection, focus on film quality as much as shade. If you want a clean look with easy visibility, stay more moderate.
Then think about how you actually use the vehicle or space. A commuter who drives before sunrise and after dark has different needs than someone who mainly drives in daylight. A homeowner with big west-facing windows has different concerns than a business with tinted storefront glass already in place.
This is where talking to a tint shop helps. A good installer should explain the difference between percentages, show you realistic options, and help you avoid paying for the wrong setup. At 865 Tint, that usually means helping customers balance looks, comfort, and budget instead of pushing the darkest film just because it sounds impressive.
The best tint choice is rarely about chasing the lowest number on the chart. It is about picking a shade and film that still makes sense six months later, when the weather heats up, the sun hits at the wrong angle, and you are the one living with the result every day.